The question many traders are asking today are long-term Bitcoin holders accumulating again, according to on-chain signals? When Bitcoin trades near key levels or after a sharp correction, investors rush to charts, sentiment indicators, and macro news. But some of the most revealing data does not come from price charts at all. It comes from the blockchain itself. On-chain analysis lets us see how coins move between wallets, how long they’ve been held, and whether “diamond hands” long-term holders are buying, selling, or simply refusing to move their BTC. In the last couple of years, on-chain data has shown that long-term Bitcoin holder supply has risen to record or near-record levels, with around three quarters or more of circulating BTC sitting in wallets that have not moved coins for months.
This is not just a geeky metric for data nerds. When Bitcoin long-term holders (LTHs) quietly accumulate while price consolidates or dips, the available supply on exchanges shrinks. That can prime the market for the classic Bitcoin “supply shock” dynamic, where even modest new demand pushes price sharply higher. Recent on-chain research has highlighted phases where LTH supply has surged by hundreds of thousands of BTC in a matter of weeks, and where long-term holders absorbed more coins than short-term holders were willing to sell.
In this article, we will break down what these on-chain signals really mean, how to read them, and what they suggest about whether long-term Bitcoin holders are accumulating right now. We will also look at how you, as an investor, can use these signals without overreacting to every move on the chain.
Understanding On-Chain Signals And Long-Term Holders
Before interpreting whether on-chain signals are showing accumulation, it helps to understand the basic concepts behind the data.
What Are On-Chain Signals?
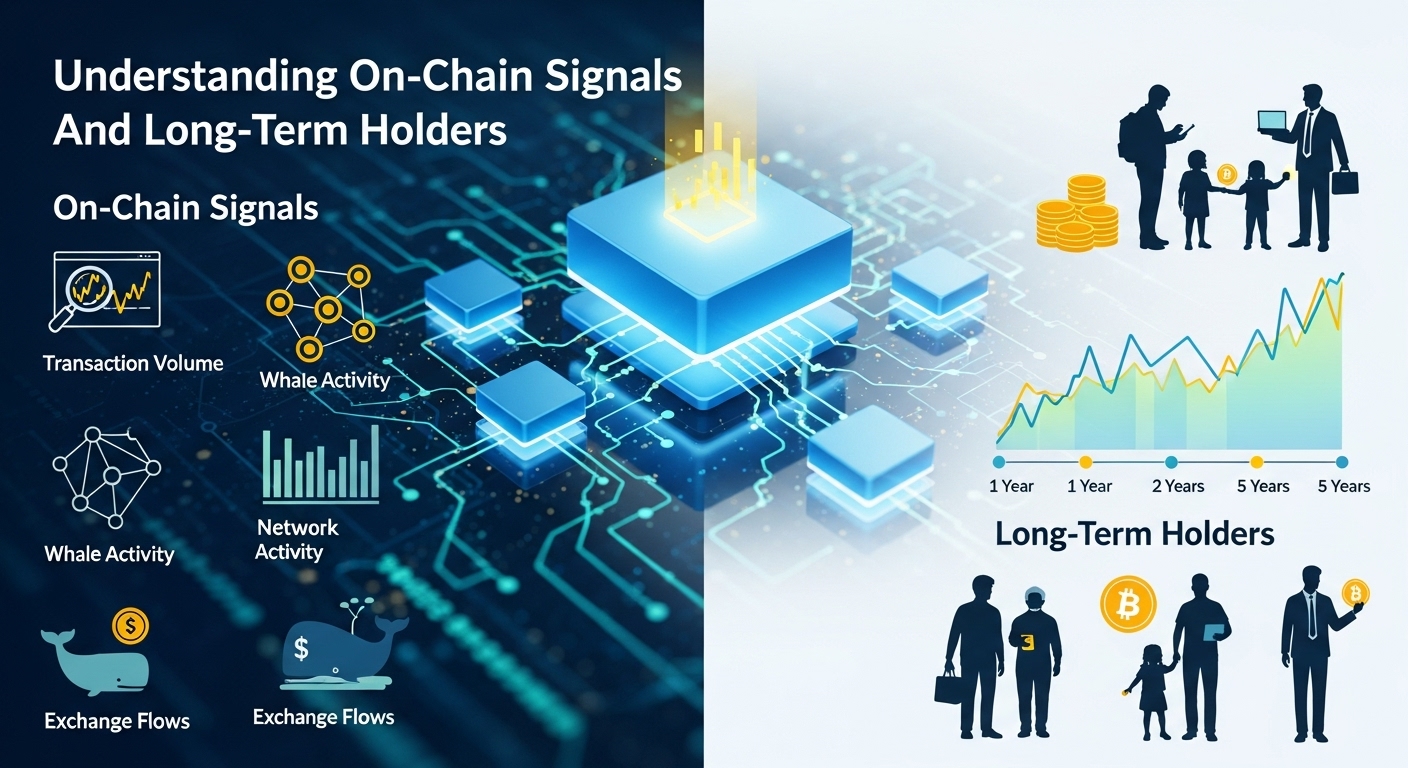
On-chain signals are insights derived directly from blockchain data. Every Bitcoin transaction is public, so analysts can aggregate wallet behavior into powerful metrics. Some of the most widely used on-chain metrics include:
The amount of BTC held by long-term holders versus short-term holders. The volume of coins moving in and out of centralized exchanges. Indicators like HODL waves, realized price, liveliness, and dormancy, which show how old coins are and how often they move. These metrics do not tell you exactly who owns a specific wallet, but they reveal behavior patterns. For example, if coins that have not moved for over 155 days suddenly become active, that may indicate profit-taking from long-term holders. If the supply held by addresses that rarely move their coins steadily rises, that is often interpreted as structural accumulation. Because these on-chain signals come from the blockchain itself, they cannot be easily faked. That is why institutional analysts, trading desks, and retail investors all track them today.
Who Counts As A Long-Term Bitcoin Holder?
Most major analytics providers define a long-term Bitcoin holder as an entity or address that has held coins for at least 155 days, roughly five months.
This threshold is not random. Historically, coins that survive beyond that age are statistically less likely to be spent in the short term. In other words, once someone has held BTC for several months, they are more likely to be a conviction-driven investor rather than a short-term speculator. So when we talk about long-term Bitcoin holders accumulating, we’re referring to those on-chain entities that: Have held their BTC for at least 155 days, Rarely move coins during volatility, Are often considered “strong hands” or “HODLers of last resort.” If this group is adding to its stack or refusing to sell even at high prices, that sends a strong message about longer-term sentiment.
What Current On-Chain Data Is Telling Us
So, are long-term Bitcoin holders accumulating right now according to on-chain signals? Recent data suggests a clear trend: long-term holders are dominant and remain heavily involved in accumulation phases.
Record Long-Term Holder Supply And Why It Matters
Several analytics platforms have reported that Bitcoin long-term holder supply has reached, or come very close to, all-time highs over the last year. In some periods, LTHs controlled around 74–80% of circulating BTC, a historically elevated level that signals strong conviction and limited willingness to sell. When such a large share of coins is locked away by long-term investors, two things tend to happen. First, the free float on the market shrinks. Fewer coins sit on exchanges ready to be market-sold at a moment’s notice. That can dampen volatility on the downside because there is simply less BTC available to dump when sentiment turns sour.
Second, if new demand appears, it has to compete for a smaller pool of liquid coins. This is the classic Bitcoin supply squeeze that has historically preceded or accompanied major bull runs. On-chain studies have highlighted that previous episodes where long-term holder supply surged to extreme levels were followed by large price expansions, as the market was forced to reprice the asset upward. In plain terms: when strong hands own most of the coins and refuse to sell, relatively small waves of fresh demand can have outsized effects.
Exchange Balances, Whales And Accumulation Patterns
Another powerful on-chain signal relates to exchange balances and Bitcoin whale behavior. When BTC is withdrawn from exchanges into cold storage or long-term wallets, it often indicates accumulation. Conversely, sharp inflows to exchanges may signal that holders are preparing to sell.
Recent reports have highlighted that Bitcoin whales and large long-term holders have continued to build positions or This pattern – miners and short-term traders selling into strength while long-term whales and institutions absorb supply – is a textbook example of accumulation. It suggests that the hands most likely to sell under stress are being replaced by more patient capital.
When the data shows:
Exchange reserves slowly drifting lower, Wallets holding at least 10 BTC or 100 BTC steadily increasing. And long-term holder supply trending up, the combined story leans strongly toward ongoing accumulation rather than distribution.
Short-Term Holder Capitulation Versus Diamond Hands

On-chain data also separates short-term holders (STHs) from LTHs. These are addresses holding coins for less than 155 days, often representing traders who bought the recent top or chased momentum. During market corrections, short-term holders often panic-sell at a loss. On-chain signals show elevated levels of coins moving at a loss and increased spending from young coins. In contrast, long-term holders typically remain calm, sometimes even adding to their positions during drawdowns. Recent analyses indicate that, in key periods, for every 1 BTC sold by short-term holders, long-term holders accumulated significantly more, reinforcing the idea that strong hands are buying dips. When you see rising loss realization among short-term holders, combined with steady or growing long-term holder supply, it often points to a transfer of coins from weak hands to strong hands – one of the clearest accumulation patterns on-chain.
Key Metrics To Watch When Asking “Are Long-Term Holders Accumulating?”
If you want to track whether long-term Bitcoin holders are accumulating, several core on-chain metrics deserve your attention.
Long-Term Holder Supply And HODL Waves
The most direct metric is Long-Term Holder Supply (LTH Supply). This shows how many BTC are held by entities that have not moved their coins for at least 155 days.
If this line is rising over weeks and months, it means coins are aging into the long-term holder category faster than they are being spent. That is a straightforward sign of accumulation.
Closely related are HODL waves, which visualize the age distribution of BTC in UTXOs. Thickening bands of older coins indicate that more BTC is sitting dormant in long-term HODL wallets. Thin, shrinking bands of young coins show that fewer coins are turning over quickly on the market.
When you see:
A rising LTH supply trend, Broad, growing older age bands in HODL waves, And a shrinking share of very young coins, you can confidently say that on-chain signals suggest long-term holders are accumulating or at least refusing to sell.
Realized Price, Cost Basis And Liveliness
Another cluster of metrics revolves around realized price and liveliness.
Realized price measures the average cost basis of the market by valuing each coin at the price it last moved, rather than the current spot price. When spot price falls near or below realized price, long-term holders who bought much earlier often sit on large unrealized gains and remain relatively unaffected, while newer entrants feel the pain. Periods where price chops around realized price, yet LTH supply keeps climbing, are classic signs that long-term investors are buying or simply holding through volatility.
Liveliness measures the balance between coin age destroyed and created. Falling liveliness indicates that more coins are sitting idle, which usually happens when HODLers choose to hold tight and accumulate.
When long-term investors are accumulating, you often see:
Together these on-chain signals tell a coherent story of patient accumulation rather than frantic trading.
On-Chain Volume, Dormancy And Spent Output Age
Additional useful signals include:
On-chain transfer volume adjusted for entities, Dormancy, which tracks how long coins were held before being spent, And spent output age bands, showing whether old or young coins are being moved. Low dormancy and low volumes of old coins being spent generally support the narrative that long-term holders are sitting tight.
What Long-Term Accumulation Means For Bitcoin’s Price Cycle
On-chain data may not predict day-to-day price moves, but long-term accumulation by strong hands has powerful implications for Bitcoin’s market cycle.
Supply Shocks And The Mechanics Of A Rally
Bitcoin has a fixed maximum supply of 21 million coins, but the effective circulating supply at any moment is much lower. When long-term holders accumulate and withdraw coins from exchanges, fewer BTC are available for trading. If spot ETFs, institutions, and retail buyers all compete for this shrinking liquid supply, the result is often a supply shock. Recent research has highlighted episodes where long-term holder supply increased by hundreds of thousands of BTC in a short time, while price held firm or consolidated. These periods sometimes preceded powerful upside moves as demand finally tipped the balance. In simple terms, on-chain accumulation builds pressure. The longer that strong hands quietly absorb coins, the more dramatic the move can be once broader market sentiment shifts bullish.
How Accumulation Phases Fit Into The Market Cycle
Zooming out, Bitcoin’s market tends to move in cycles:
As price cools, some investors capitulate, selling at a loss. During these sideways or down phases, long-term believers often step in to accumulate, increasing LTH supply and reducing liquid supply. Eventually, when macro conditions or narratives align, demand surges into a tight supply, sparking a new leg higher. On-chain data over multiple cycles has repeatedly shown that major peaks in long-term holder supply tend to appear in late-stage bear markets or early bull phases. As rallies mature, some of these long-term holders gradually distribute coins into strength, and LTH supply begins to decline. So when you see on-chain signals showing long-term holders accumulating, it often corresponds to a mid- or late-accumulation phase – historically a constructive backdrop for long-term investors, though not a guarantee of immediate upside.
Risks And Limitations Of Reading On-Chain Data
As powerful as on-chain signals are, they have limitations.
First, on-chain data does not track off-chain transactions inside centralized platforms, custodians, or derivative markets. A large amount of BTC trading happens in futures, options, and internal order books that do not register as on-chain movements. Second, labels like “long-term holder” and “whale” are statistical, not precise identities. One large entity like an exchange or ETF custodian might represent thousands of individual investors. Third, markets can temporarily ignore fundamentals. It is possible for LTH supply to be high while price still corrects, especially if macro conditions deteriorate or if there is aggressive futures liquidation. While historical patterns are insightful, there is no guarantee that the next cycle will play out exactly like the last one.
How Investors Can Use These On-Chain Signals Responsibly
So how can you use the insight that long-term Bitcoin holders are accumulating without overreacting to every data point?
Combining On-Chain, Technical And Macro Analysis
The most robust approach is to treat on-chain analysis as one pillar of a broader framework that also includes:
Traditional technical analysis on price and volume, Macro and liquidity conditions, Regulatory developments and institutional adoption trends. For example, if on-chain data shows LTH supply at or near record highs, exchange reserves trending lower, and Bitcoin whales continuing to add during dips, that provides a strong long-term bullish context. If, at the same time, macro conditions are improving, spot ETF inflows are strong, and technical structure shows higher lows, your conviction in a long-term bullish thesis can reasonably grow.
Building A Long-Term Strategy Around Accumulation Data
If you are a long-term investor, you can use on-chain signals to refine, rather than dictate, your strategy.
You might decide to:
Be more aggressive with dollar-cost averaging when LTH supply is rising, short-term holders are realizing losses, and price is consolidating. Be more patient or take partial profits when on-chain data shows long-term holders distributing into euphoric rallies.
Conclusion
Pulling everything together, the overarching message from on-chain signals in recent periods is clear: long-term Bitcoin holders remain dominant and, in many phases, have been actively accumulating. several key windows, long-term holders have absorbed more coins than short-term traders were selling, even as price chopped sideways or corrected.This behavior does not guarantee immediate price gains, but it does paint a picture of a market where strong hands control the majority of supply, and where future demand could trigger another supply-driven move higher.