Bitcoin Price

Understanding bitcoin price analysis technical indicators is crucial for anyone looking to navigate the volatile cryptocurrency market successfully. Whether you’re a seasoned trader or just starting your crypto journey, mastering these powerful analytical tools can significantly improve your trading decisions and risk management strategies.
Technical indicators serve as mathematical calculations based on bitcoin’s price, volume, or open interest data. These tools help traders identify trends, predict potential price movements, and determine optimal entry and exit points. In today’s rapidly evolving cryptocurrency landscape, having a solid grasp of bitcoin price analysis technical indicators can mean the difference between profitable trades and costly mistakes.
The cryptocurrency market operates 24/7, making it essential to have reliable analytical frameworks that work across different time zones and market conditions. This comprehensive guide will walk you through the most effective technical indicators specifically tailored for bitcoin price analysis, helping you build a robust trading strategy.
Understanding the Foundation of Bitcoin Price Analysis Technical Indicators
Technical analysis forms the backbone of successful cryptocurrency trading. Unlike fundamental analysis, which focuses on underlying factors like adoption rates and regulatory developments, technical analysis relies purely on price action and market data. Bitcoin price analysis technical indicators provide objective, mathematical interpretations of market sentiment and momentum.

The beauty of technical indicators lies in their ability to filter out market noise and highlight significant trends. Bitcoin’s notorious volatility can overwhelm novice traders, but experienced analysts use these tools to identify patterns within the chaos. By combining multiple indicators, traders can develop a more comprehensive understanding of market dynamics. Most professional traders don’t rely on a single indicator but instead create a toolkit of complementary tools. This approach helps reduce false signals and increases the probability of successful trades. The key is understanding how different indicators work together and when to trust their signals.
Essential Moving Averages for Bitcoin Analysis
Moving averages represent the most fundamental category of technical indicators for bitcoin analysis. These tools smooth out price fluctuations over specified periods, revealing underlying trends that might otherwise be obscured by daily volatility.
Simple Moving Average (SMA) Strategy
The Simple Moving Average calculates the average price over a specific number of periods. For bitcoin traders, the 20-day, 50-day, and 200-day SMAs are particularly significant. When bitcoin’s price trades above these moving averages, it often indicates bullish momentum, while prices below suggest bearish conditions.
Professional traders watch for “golden cross” patterns, where shorter-term moving averages cross above longer-term ones. Conversely, “death cross” patterns, where short-term averages fall below long-term ones, often signal potential downtrends.
Exponential Moving Average (EMA) Applications
Exponential Moving Averages give more weight to recent prices, making them more responsive to current market conditions. The 12-day and 26-day EMAs form the foundation of the popular MACD indicator, while the 21-day EMA serves as a dynamic support and resistance level.
Bitcoin’s fast-moving nature makes EMAs particularly valuable for short-term trading strategies. These indicators help traders identify trend changes earlier than traditional SMAs, though they can also produce more false signals during sideways markets.
Momentum Indicators: RSI and MACD Analysis
Momentum indicators measure the speed and strength of price movements, helping traders identify overbought and oversold conditions in bitcoin markets.
Relative Strength Index (RSI) Mastery
The RSI oscillates between 0 and 100, with readings above 70 typically indicating overbought conditions and readings below 30 suggesting oversold levels. However, during strong bitcoin bull runs, RSI can remain overbought for extended periods, making it essential to combine this indicator with others.
Smart traders look for RSI divergences, where the indicator moves opposite to price action. Bullish divergences occur when bitcoin makes lower lows while RSI creates higher lows, often signaling potential reversals. Bearish divergences show the opposite pattern and can indicate upcoming corrections.
MACD Signal Line Strategy
The Moving Average Convergence Divergence (MACD) consists of three components: the MACD line, signal line, and histogram. This versatile indicator helps identify trend changes and momentum shifts in bitcoin markets.
MACD crossovers provide clear buy and sell signals. When the MACD line crosses above the signal line, it generates a bullish signal, while crossovers below create bearish signals. The histogram shows the difference between these lines, indicating momentum strength.
Volume-Based Indicators for Bitcoin Trading
Volume analysis adds another dimension to bitcoin price analysis technical indicators, confirming price movements and identifying potential reversals.
On-Balance Volume (OBV) Insights
OBV adds volume on up days and subtracts volume on down days, creating a cumulative indicator that shows money flow. When OBV trends upward while bitcoin prices remain flat, it often indicates accumulation by smart money, suggesting future price increases.
Divergences between OBV and price action can signal trend changes before they become apparent in price charts. This makes volume-based indicators particularly valuable for identifying early entry and exit opportunities.
Volume Weighted Average Price (VWAP)
VWAP shows the average price weighted by volume, serving as a benchmark for institutional traders. When bitcoin trades above VWAP, it indicates that current buyers are paying more than the average price, suggesting bullish sentiment.
Professional traders use VWAP as dynamic support and resistance levels, particularly during intraday trading. The indicator resets daily, making it especially useful for short-term bitcoin trading strategies.
Advanced Pattern Recognition and Oscillators
Beyond basic indicators, sophisticated traders employ advanced tools for deeper market analysis.
Bollinger Bands Strategy
Bollinger Bands consist of a middle line (typically a 20-period SMA) and upper and lower bands set at two standard deviations. These bands expand during volatile periods and contract during consolidation phases.
Bitcoin prices often bounce between the bands, with touches of the upper band suggesting overbought conditions and lower band touches indicating oversold levels. However, during strong trends, prices can “walk the bands,” staying near the upper or lower boundaries for extended periods.
Stochastic Oscillator Applications
The Stochastic Oscillator compares bitcoin’s closing price to its price range over a specific period. This momentum indicator ranges from 0 to 100, with readings above 80 indicating overbought conditions and readings below 20 suggesting oversold levels.
The indicator consists of two lines: %K and %D. Crossovers between these lines generate trading signals, while divergences with price action can indicate potential reversals. The Stochastic works particularly well in ranging markets but can produce false signals during strong trends.
Combining Multiple Indicators for Better Results
The most successful bitcoin traders don’t rely on single indicators but instead create comprehensive analysis frameworks. Combining trend-following indicators like moving averages with momentum oscillators like RSI creates a more balanced approach to market analysis.
For example, a trader might wait for bitcoin to break above the 50-day EMA (trend confirmation) while RSI shows oversold readings recovering above 30 (momentum confirmation). This multi-indicator approach reduces false signals and increases trade success probability. Risk management remains paramount regardless of which indicators you choose. Setting stop-losses based on technical levels and position sizing according to account risk tolerance should always accompany your technical analysis strategy.
Common Mistakes to Avoid
Many traders make the mistake of over-relying on lagging indicators or ignoring market context. Bitcoin’s unique characteristics require adapted approaches to traditional technical analysis. Additionally, blindly following indicator signals without considering broader market conditions often leads to poor trading results.

Another common error involves using too many indicators simultaneously, creating analysis paralysis. Focus on mastering a few reliable indicators rather than attempting to monitor dozens of different tools.
Practical Implementation Tips
Start with basic indicators and gradually add complexity as your understanding improves. Paper trading allows you to test indicator combinations without risking real capital. Keep detailed records of your trades and indicator signals to identify which combinations work best for your trading style.
Market conditions change, and indicator effectiveness can vary during different market phases. Bull markets might favor momentum indicators, while bear markets often see better results from oversold bounce strategies using oscillators.
Final Thought
Mastering bitcoin price analysis technical indicators requires dedication, practice, and continuous learning. The indicators discussed in this guide provide a solid foundation for making informed trading decisions in the volatile cryptocurrency market. Remember that no indicator is perfect, and successful trading combines technical analysis with proper risk management and market awareness.
Start by implementing basic indicators like moving averages and RSI, then gradually expand your toolkit as you gain experience. The key to success lies not in finding the perfect indicator combination but in consistently applying a proven methodology that suits your trading style and risk tolerance. Ready to improve your bitcoin trading results? Begin incorporating these bitcoin price analysis technical indicators into your trading strategy today, and remember to always practice with paper trading before risking real capital in this exciting but unpredictable market.


 Correlation coefficients range from -1 to +1, where +1 indicates perfect positive correlation, -1 shows perfect negative correlation, and 0 suggests no relationship. Understanding these metrics provides valuable insights into portfolio diversification and risk management strategies. The correlation between Bitcoin and stocks has evolved significantly since Bitcoin’s inception. Initially, Bitcoin operated as an uncorrelated asset, but recent years have shown periods of increasing correlation, particularly during market stress events and economic uncertainty.
 Suggested outbound link: Consider linking to a reputable financial data provider like Yahoo Finance or Bloomberg for correlation data.
 Bitcoin $107K Israel-Iran conflict function as a “digital gold” is still changing. But it has trouble in places where people don’t want to take risks. The present conflict has caused oil prices to rise sharply and has led to a general market retreat from assets with a lot of volatility. As things get worse. Bitcoin’s ability to hold value will be put to the test. Even if people are generally positive about Bitcoin in the long run. It’s likely that it will be affected by dramatic drops in traditional markets. This geopolitical stress may change how people see Bitcoin as a non-correlated asset. Or it may make people think that it is still subject to risk at times of global crises.
 On the other hand, if the present range doesn’t hold, the price might drop to $102,000 or below, especially if news about geopolitics causes a worse market correction. Short-term traders and long-term investors both need to stay on their toes because volatility is likely to continue.
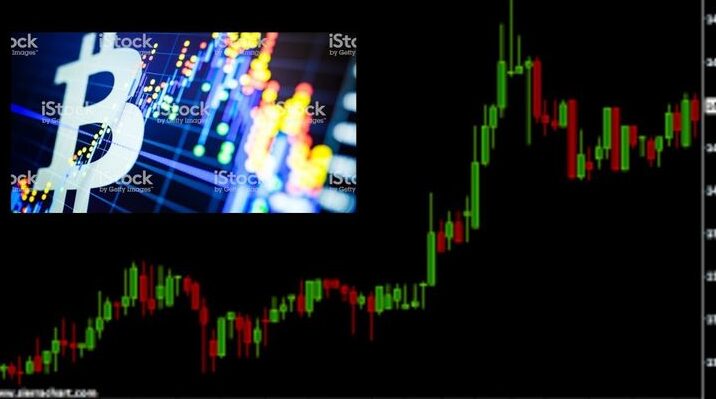
 The Relative Strength Index (RSI) has dropped out of the overbought zone, indicating that BTC is now in a more balanced zone where it can build up. Volume levels have remained unchanged, indicating that investors are still interested, despite some short-term concerns. This time of standstill is similar to how things have been in the past during important global events. When big geopolitical or economic decisions are in the air, such as the fate of US-China trade talks, investors are less likely to make risky investments.
 Similarly, Bitcoin’s historic surge to roughly $20,000 in 2016 and 2017 followed a prolonged period of rising oil prices, which were triggered by OPEC’s production cuts. Even if correlation doesn’t imply causation, the fact that Bitcoin consistently follows oil’s bullish moves suggests that there are larger economic factors that affect both markets simultaneously, such as fears of inflation, fiat liquidity, and investor behavior.

 On-chain statistics provide further evidence of the validity of this comeback. According to Glassnode data, Bitcoin accumulation among “whale” addresses—wallets containing more than 1,000 BTC—has started purchasing on price declines, and this trend is rising. Likewise, hashrate and mining difficulty remain strong indicators of network health. Highlighting the fundamental security and confidence in the Bitcoin blockchain. Despite brief price fluctuations. These principles show the dual character of the market—solid long-term conviction tempered by short-term caution—vastly different from the fragility of the price action.
 However. As a store of value and an inflation-resistant asset. Bitcoin’s fixed quantity and distributed character. When viewed over longer time horizons. Accentuate its value proposition. This dichotomy helps explain the sometimes conflicting price behavior observed during economic crises: a short-term linkage with risk assets and a long-term dissociation driven by adoption patterns and shortages.