As we enter a new chapter in the evolving saga of the crypto market, the much-anticipated “Moonvember” rally for Bitcoin may not be materialising in the way many bulls hoped. For months, investors have leaned on seasonal optimism and historical patterns to anticipate a strong November breakout. Yet recent commentary from major analysts suggests a much more muted outcome: rather than a meteoric climb, Bitcoin could experience sideways trading throughout the month, marked by consolidation, indecision, and a testing of market strength. In this article, we will explore why analysts are tempering expectations, what the key drivers of Bitcoin’s price behaviour are, and how traders and long-term holders might position themselves in light of this sideways scenario. We’ll examine the macroeconomic backdrop, on-chain data, technical levels, and risk factors, weaving in related phrases such as crypto consolidation period, trading range, and Bitcoin price stability to build a fuller picture that remains readable yet optimised for search.
Why the “Moonvember” Narrative Is Losing Steam
Historically, November has been a strong month for Bitcoin. The term “Moonvember” refers to the hope that Bitcoin will soar to new highs during this month, thanks to favorable seasonality and market sentiment. The reasons for this shift are multifaceted: first, mixed signals from the Fed regarding rate cuts have reduced the bullish tailwinds for risk assets like Bitcoin. Second, the absence of a fresh catalyst means momentum is lacking. And third, profit-taking from long-term holders, combined with a pause in retail frenzy, is increasing the odds of a sideways market. As the Bitfinex team put it, unless Bitcoin decisively recovers above its current range, “time becomes a growing headwind for bulls. Thu, the “Moonvember” hype is being replaced by a more cautious view of a trading range months. While this may disappoint those seeking fast gains, it is a natural phase in asset markets when fundamental and technical drivers are in a holding pattern.
The Macro Backdrop: Interest Rates, Liquidity, and Market Sentiment
A key reason why Bitcoin could trade sideways is the broader economy’s influence on crypto markets. The global monetary policy environment remains uncertain, and that has significant repercussions for digital assets.
Fed Uncertainty and Interest-Rate Dynamics
One of the most significant variables influencing Bitcoin is how the Federal Reserve manages interest-rate policy. Lower rates historically tend to benefit risk assets, including Bitcoin, because alternative yields and safe havens decline, and speculative capital flows increase. According to the CME FedWatch Tool, the odds of a rate cut in December stood below 70 %—a meaningful decline from earlier expectations. The Bitfinex analysts noted that the mixed messaging from the Fed supports consolidation rather than breakout behaviour. When a major driver like interest-rate expectations is uncertain, markets often hesitate.
Liquidity and Risk Appetite
Apart from direct policy, liquidity in markets—training on institutional flows, hedging behaviour, and leverage—is another major factor. The recent uncertainty has dampened risk appetite. As a result, capital that might have flowed aggressively into Bitcoin may instead remain on the sidelines or rotate into more traditional assets. That shift in flow dynamics often translates into a flat or range-bound price for Bitcoin as opposed to strong upward momentum.
Sentiment, Distribution, and On-Chain Signals
Beyond macro factors, on-chain data and investor sentiment are telling a similar story of moderation. For example, the firm Bitwise argues that Bitcoin is undergoing a “silent IPO” moment: early investors are harvesting gains, institutions are gradually entering, and for now, the asset is in a re-distribution phase. This process naturally implies more sideways price action as supply and demand reach a new equilibrium. In sum, the macroeconomic context is less supportive of an explosive price rise for Bitcoin and more supportive of a period of consolidation, aligning with analysts’ forecast of sideways movement.
Key Technical Levels and Why They Support Sideways Movement
 Technical analysis remains a core tool for traders and analysts in forecasting how price action may evolve. For Bitcoin, specific resistance and support zones have emerged that now serve as boundaries for potential sideways trading.
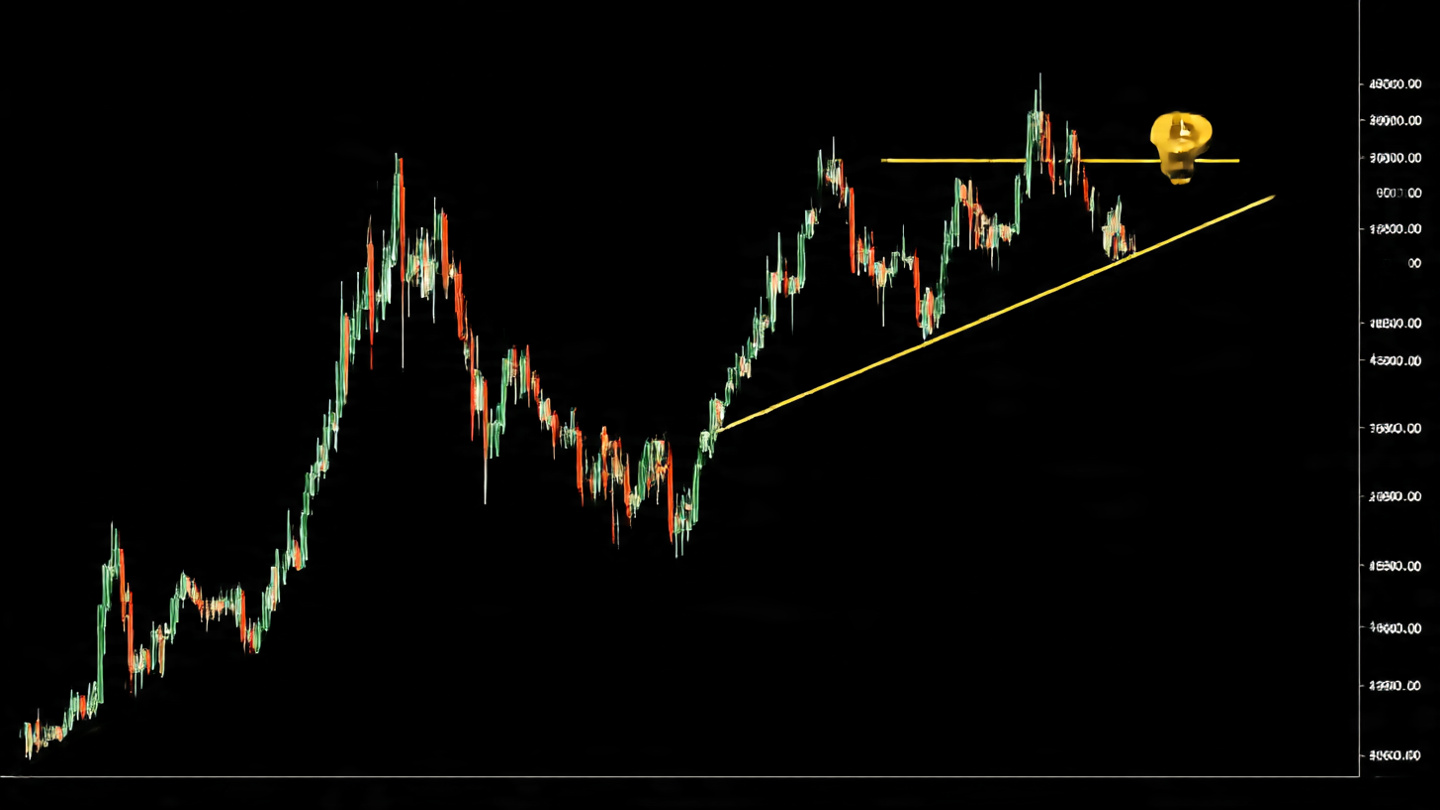
Resistance Zone Near $116,000 +
According to market commentary, Bitcoin has been unable to decisively climb above approximately $116,000. Bitfinex analysts flagged this as a crucial level: unless Bitcoin recovers above this range, it faces a headwind for further upside. Practically, this means that bulls cannot yet claim control, and hesitation at this juncture suggests the price may remain capped from the top.
Support Zone Near $103,000-$105,000
On the flip side, key support appears around the $103,000 level (or slightly above) for Bitcoin. The asset recently dropped below this region, adding weight to support concerns. The presence of a firm support floor means that the price may bounce between these upper and lower bounds, thus reinforcing the idea of a trading range.
Consolidation and Reduced Volatility
Sideways markets often display less volatility compared to impulsive directional moves. Bitcoin’s current behaviour of drifting within a range rather than making large bursts aligns with expectations of a reduced-volatility phase. This can be a double-edged sword: less risk of large drawdowns, but also less chance of outsized returns in the short term.
Therefore, from a technical vantage point, Bitcoin is seemingly tilting toward a range-bound pattern: capped overhead resistance, tested support beneath, and unclear breakout triggers. That supports the claim analysts are making about sideways trading this month.
Market Implications for Traders and Investors
Given the likelihood of a sideways trading phase for Bitcoin, both short-term traders and long-term investors may need to adjust their strategies accordingly. Understanding how to navigate a market that lacks a strong directional bias is key.
For Short-Term Traders
Traders accustomed to breakout momentum may need to shift to range-trading strategies, which involve buying near support, selling near resistance, and monitoring stop-losses in case a breakout occurs. In a sideways market, the risk-reward for trend-following may be less compelling. Additionally, leverage and aggressive positions may introduce undue risk if the market simply oscillates rather than trends.
For Long-Term Investors
For those holding Bitcoin for the long haul, a sideways month is less dramatic. It can be viewed as a healthy consolidation phase—a pause between the previous upswing and the next potential leg. As Bitwise’s commentary suggests, internal redistribution and institutional accumulation during range phases can set the stage for future growth. Viewing this sideways period as a “gift” to accumulate more might be a calmer, patient approach.
Risk Management and Market Awareness
No matter the timeframe, risk management remains vital. Even in sideways markets, external shocks or policy shifts can trigger sudden directional change. Monitoring macro developments—such as a surprise rate cut, regulatory change, or large institutional movement—is important. Having defined entry and exit rules and being prepared for a breakout either way remains prudent. Thus, the shift toward range-trading isn’t passive; it simply requires adaptation of mindset and tactics rather than expecting runaway gains.
What Could Break the Sideways Trend? Catalysts to Watch
While the current expectation is sideways trading, markets can pivot quickly. Identifying potential triggers for a breakout or breakdown is critical for staying ahead.
Positive Catalysts for an Upside Breakout
Several factors could reignite bullish momentum for Bitcoin. One major trigger would be a clear and decisive rate cut or dovish message by the Federal Reserve. If such a move stimulates risk-asset flows, Bitcoin may quickly break out of its range. Similarly, announcements of large institutional adoption, major corporate treasury allocations, or accelerated ETF inflows could shift sentiment sharply.
Negative Catalysts for a Breakdown
Conversely, if the Fed signals no further cuts or signals tightening, that could dampen risk appetite and push Bitcoin below support. Regulatory shocks, large-scale liquidations, or macro surprises (such as inflation spikes or fiscal instability) could also force a breakdown. A move beneath support could trigger a sharper decline rather than just a gradual drift.
The Probability of Trigger vs Status Quo
Right now, analysts view breakout probability as more limited in the short term, which is why the consensus is for consolidation. Unless one of the catalysts above occurs with sufficient force, the default path may remain drifting within the established range. In other words, until there is a reason to run, Bitcoin may simply walk.
Longer-Term Perspective: Sideways Now, Upside Later?
 It’s essential to frame the current sideways phase within a longer-term context. Even if this month or the following weeks are marked by range-bound action, that does not negate longer-term bullish narratives for Bitcoin.
Institutional Adoption and Market Maturation
The commentary by Bitwise’s Matt Hougan sees the current sideways behaviour as analogous to a tech IPO’s quiet period, where early investors take profits and institutions enter more quietly. That suggests this phase may be part of a maturation process for Bitcoin rather than a sign of weakness. Over time, as volatility compresses and institutional allocations grow, Bitcoin could exhibit stronger, more sustained upward trends.
Medium-Term Upside Exists
Although near-term momentum may be limited, many firms remain bullish over the medium-term horizon. For example, JPMorgan estimates Bitcoin could reach around $170,000 in the next 6-12 months based on volatility comparisons to gold. Such targets imply that a sideways month may simply be a pause in a broader uptrend.
Importance of Patience and Time Horizon
For investors who anchor on long-term time horizons, periods of consolidation or sideways trading are less troublesome. Indeed, they may offer better opportunities to accumulate at favourable levels. If the long-term thesis remains intact—adoption, digital store of value, inflation hedge—then short-term sideways trading needn’t derail confidence. So while this month may feel quiet, for many, the narrative remains bullish; it is simply being tempered by recognition of the current cycle’s realities.
Conclusion
In summary, the much-hyped “Moonvember” scenario for Bitcoin may be giving way to a more modest reality: a month of sideways trading. The convergence of macro uncertainty, interest-rate ambiguity, institutional re-balancing, and technical constraints all point toward consolidation rather than breakout. Analysts from firms like Bitfinex explicitly caution that unless Bitcoin can reclaim key resistance levels and secure a catalyst, the price may drift within a defined range for the short term.
For traders, this means adjusting strategies toward range-bound tactics, focusing on support/resistance flows rather than breakout bets. For long-term investors, it means viewing this as a potentially healthy pause—a chance to accumulate and await the next leg higher. While patience may be required, the long-term bullish case for Bitcoin remains intact. Ultimately, this sideways phase may be less exciting than a moonshot, but it might also be more strategic: a consolidation before the next climb. Being aware of this reality, staying disciplined in risk management, and keeping an eye on catalysts will serve participants well in navigating the months ahead.
FAQs
Q. Will Bitcoin definitely trade sideways this month?
No market outcome is guaranteed. While the probability of sideways trading is elevated given current signals, a strong catalyst—such as a major regulatory approval, a surprise rate move from the Fed, or a large institutional sweep—could trigger a breakout either up or down. The sideways scenario simply appears the most likely in the near term, according to current analysis.
Q. What price range should I expect if Bitcoin trades sideways?
Analysts have highlighted approximate ranges for this phase. For instance, support near $103,000-$105,000 and resistance near $116,000 have been cited as key zones. If the market remains in this range, expect oscillation between these levels rather than a clear trend.
Q. How should I adjust my strategy if I’m a short-term trader?
In a sideways market, consider swapping trend-following approaches for range-trading techniques: buy near support, sell near resistance, tighten stop-losses, and avoid heavy leverage. Also monitor for breakout signals. Be ready to shift strategy rapidly if the market leaves the range.
Q. Does sideways trading mean the long-term bullish case is dead?
Not at all. Sideways action can simply be a consolidation phase in a longer bullish cycle. As noted above, institutions are entering and distribution from early investors is happening, which can support stronger moves later. The lack of immediate upside doesn’t imply the long-term thesis is invalid.
Q. What major catalysts should I watch to see a change in direction?
Key catalysts include: a clear dovish shift by the Federal Reserve (e.g., a rate cut with strong commentary), significant institutional investment announcements, regulatory or ETF developments, macro events that drive risk-on sentiment, or major on-chain shifts (for example, large wallet accumulation or movement). Any of these could break Bitcoin out of its range.
Read More. Crypto Treasuries Shift to Fringe Tokens as Bitcoin Cools