The Bitcoin price has spent most of 2025 oscillating between dizzying rallies and nerve-testing drawdowns. That volatility has fueled a new round of analyst calls—some wildly bullish, others soberly cautious. Among the most discussed warnings is a scenario in which the Bitcoin price crashes to $87,000 if a specific market trigger fires. In this in-depth analysis, we unpack the thesis behind that call, explain the technical and on-chain reasoning, examine the macro backdrop, and outline what a trip toward $87K would likely look like in real time.
Far from fear-mongering, the goal here is to make the signal visible amid the noise. If the trigger never arrives, great—price may resume its uptrend. But if it does, you’ll understand what’s happening, why it’s happening, and how sophisticated traders and long-term investors typically navigate it.
The $87,000 thesis in one sentence
The core idea is straightforward: if Bitcoin loses a key mid-cycle support band while leverage remains elevated and miners are forced to sell into weakness, the Bitcoin price could cascade toward $87,000—a level many technicians view as a high-probability liquidity pocket and prior breakdown zone. Several market watchers have flagged this area in 2025 as a magnet for downside “fills,” especially when risk unwinds quickly. Reports during the February sell-off noted spot price briefly probing the high-$80Ks amid macro jitters and exchange-related headlines, reminding traders that this pocket is very much in play.
What is the actual trigger?
Analysts differ on the exact wording, but the trigger typically comprises three parts that can occur in quick succession:
-
Support failure at a widely watched level. When a mid-cycle floor breaks on high volume, algorithms flip from buy-the-dip to sell-the-rip. In 2025, traders have focused on ranges where $90,000–$92,000 acted as a pivot; cleanly losing that band can open the path to the high-$80Ks. Coverage during the winter sell-off highlighted how a swift slide below $90K accelerated downside.
-
Leverage washout and liquidity magnets. Market structure matters. Liquidity “pools” often sit around prior highs/lows and round numbers. Analysts have repeatedly pointed to $87,000–$90,000 as a zone heavy with resting orders and stop clusters in 2025—a magnet if order flow rushes downhill. Research notes this spring discussed traders “eyeing $87K” as a downside objective if momentum turned.
-
Miner stress turning into net supply. When margins compress (post-halving or after sharp price drops), some miners liquidate inventory and even machines—a phase known as miner capitulation. That additional spot supply during a risk-off moment can sharpen a move. On-chain analysts have warned that capitulation waves tend to line up with corrections and can deepen them if they start while technicals are already fragile.
Put differently, the trigger is a confluence: a technical breakdown that collides with crowded positioning and a temporary uptick in miner-driven sell pressure.
Why $87,000? The technical logic behind the target
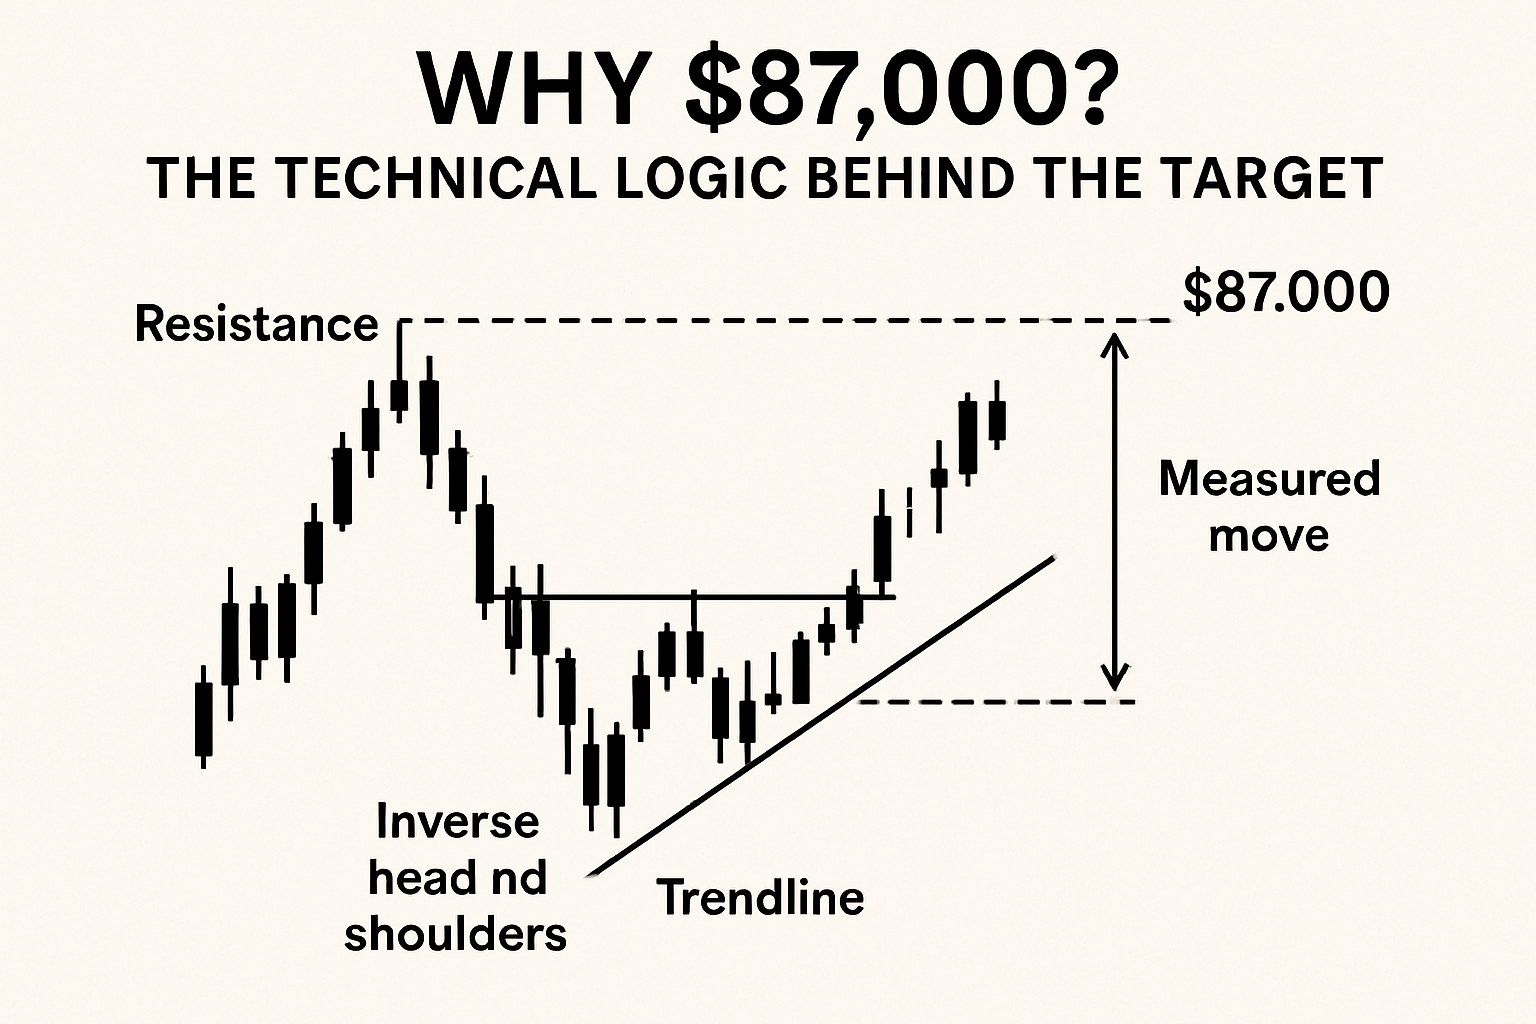
Former support, now liquidity magnet
Price doesn’t move in straight lines; it hunts liquidity. The $87K–$90K band has served as both resistance and support at different times in 2025, making it a likely “reversion” area when momentum snaps. Coverage throughout the year repeatedly referenced the $87K handle during both surges and stumbles, reinforcing its salience to traders and algos alike.
Patterns and measured moves
Some technicians have highlighted head-and-shoulders variants and rising wedge breaks that—if confirmed—point to measured move targets in the high-$80Ks. Commentary this year even discussed fake-outs above the upper $80Ks that reverse hard, sending price back to support zones in the $78K–$90K region, depending on where the neckline resolves.
Order flow and stop cascades
Leveraged markets move fastest when stops stack up. If a cascade begins above $90K, the next deep pool often sits near $87,000, where sidelined buyers expect fills and short sellers target take-profit. Because so many eyes are glued to it, the level can behave like a magnet—especially during risk-off bouts driven by macro headlines or exchange news.
The macro “if”: what could flip the switch?
Unexpected policy or growth shock
Crypto doesn’t live on an island. A hotter-than-expected inflation print, hawkish central-bank messaging, or tariff-driven growth scares can yank liquidity out of risk assets. Reports earlier this year tied a swift crypto sell-off to tariff fears and broader equity volatility—a reminder that macro winds can still dominate tape action for the Bitcoin price in the short run.
Exchange or infrastructure headlines
From security breaches to regulatory actions, infrastructure shocks can accelerate existing moves. Commentary during sell-offs mentioned how exchange-related news compounded risk aversion across majors like ETH, SOL, and XRP, helping push Bitcoin price into the high-$80Ks on intraday spikes.
Miner profitability squeeze
After halvings or during prolonged sideways ranges, miners can experience margin compression. That’s when hash-ribbon indicators sometimes flag capitulation—periods historically associated with volatility. If such a squeeze begins while support breaks, it feeds supply into a falling market, hastening a revisit of $87K.
How a move toward $87,000 could unfold, step by step
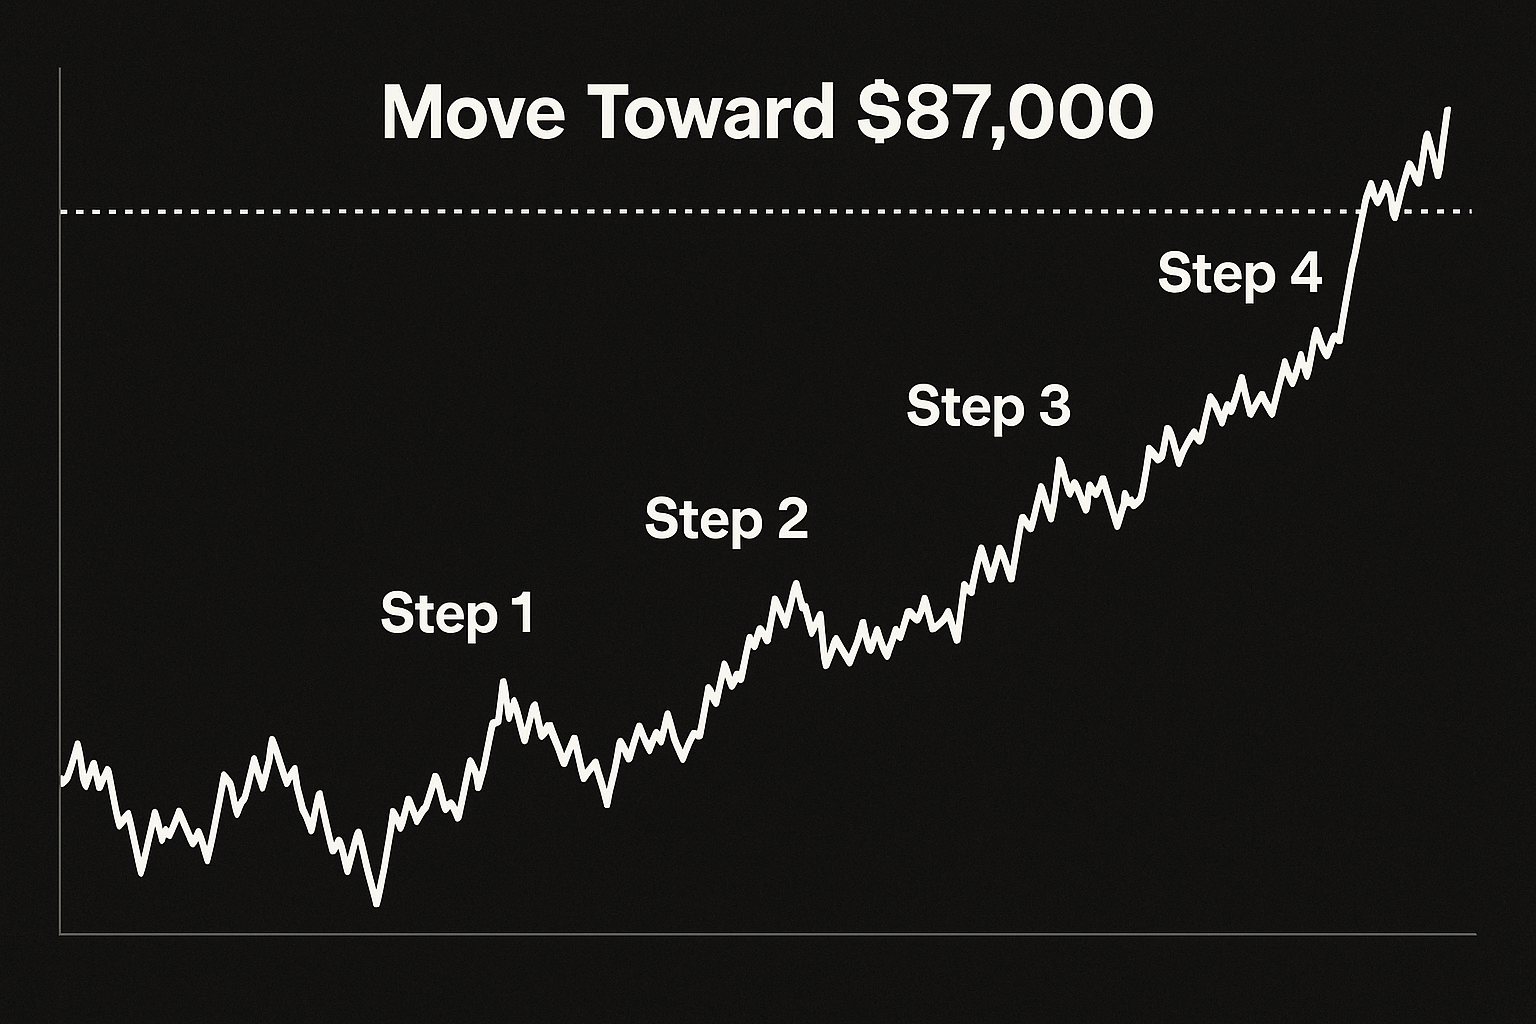
Step 1: The breakdown
Price tests a known pivot around $90K–$92K multiple times. On a high-volume session—often overlapping a macro headline—it slices through cleanly. Lower time frames print wide candles; funding and OI (open interest) remain stubborn initially, then flip as longs puke. Market depth around $89K thins out.
Step 2: The acceleration
Momentum algos detect the shift. As bids pull, stops trigger in waves. Perennial liquidity targets—round numbers like $90K and $87K—become velocity points. Analysts tracking order books watch the $87K–$88K ladder for large passive buyers. Until they appear, the path of least resistance is down.
Step 3: The test and reaction
Into the $87K pocket, large bids finally show. Volatility spikes, wicks extend, and the Bitcoin price either sharply rebounds (classic “stop run and reverse”) or consolidates sideways. If miners are still selling and macro remains shaky, the first bounce can fail, forcing a deeper probe of the range. If on-chain flow steadies and ETF demand re-engages, that first tag can mark a local low.
What the bears might be missing
Structural demand isn’t gone
While tactical dips can be brutal, structural buyers—treasuries, asset managers, RIA platforms allocating via ETFs—often become more active on red days. That steady spot demand didn’t exist to the same extent in earlier cycles and can soften the landing near $87K.
Miner capitulation can end abruptly
Capitulation waves don’t last forever. When weaker operators exit and hash stabilizes, the absence of miner sell pressure can be a tailwind. Analysts have noted multiple times that capitulation cycles often bookend meaningful bottoms in prior years.
Crowded downside targets can front-run
Because so many traders watch $87,000, markets sometimes front-run the level, reversing at $88K–$89K. Conversely, if the move is too obvious, price can “overshoot,” briefly tagging $85K–$86K before mean-reverting. That’s why execution plans are as important as the thesis itself.
Technical markers to watch around the trigger
The support band
If you’re tracking the Bitcoin price, monitor whether daily closes reclaim or reject the $90K–$92K pivot after a breakdown. Reclaims signal trap risk; persistent rejection keeps the $87K magnet alive.
Market structure: higher lows vs. lower highs
On 4-hour and daily charts, a shift to lower highs and lower lows confirms the bear control. If higher lows form immediately after an $87K tag, it hints the flush already happened.
Open interest and funding
During real capitulations, OI collapses and funding resets or even flips negative as late shorts pile in. A washout without a meaningful OI drop is often just a shake, not a reset.
Miner flows and hash ribbon signals
Spikes in miner outflows to exchanges, combined with hash ribbon crossovers, can corroborate the “supply into weakness” portion of the trigger. If those metrics cool as price approaches $87K, the downside may be limited.
Risk management if the trigger fires
Position sizing and invalidation levels
Whether you trade or invest, know your line in the sand. If you’re long from above $95K–$100K, a clean daily close below the pivot might be your risk signal. If you’re waiting to buy $87K, decide in advance whether you’ll scale in or require confirmation via a reclaim.
Time horizon matters
Short-term traders may treat $87K as a tactical scalp zone; long-term allocators might view it as a value add. The same price can mean opposite actions depending on horizon and mandate.
Avoid over-optimization
No one nails the exact print. Scaled orders and patience usually outperform heroic precision. If liquidity is chaotic, spreads widen; forcing fills can be costlier than waiting for structure to rebuild.
Could $87,000 become a springboard?
The case for a reflexive rebound
If the Bitcoin price washes into $87K on a headline and then macro stabilizes, a violent V-shape is possible. Prior episodes showed that once stops clear and late shorts crowd in, an upside squeeze can unfold. Analysts this year have argued that a swift dip to $87K could be followed by an equally swift squeeze if liquidity re-engages.
The case for a range
Alternatively, $87K–$92K could morph into a months-long value area, with rotational flows between ETFs, miners, and derivatives desks. Ranges build energy. A patient consolidation can be the healthiest outcome for higher-time-frame bulls.
What if the trigger never happens?
If the pivotal support holds and miners stabilize, the bear trigger simply doesn’t fire. In that case, the Bitcoin price can grind higher, potentially hunting liquidity above prior highs. Throughout 2025, multiple notes emphasized that a trip above yearly opens could squeeze shorts before any deeper dip—showing just how path-dependent outcomes are.
Conclusion
The analyst’s warning about a Bitcoin price crash to $87,000 is really a map of how downside can cascade when conditions align. It doesn’t demand panic or prediction—only preparation. If the trigger hits, you now know why $87K is in focus, what signals to track, and how traders frame the subsequent bounce or range. If it never hits, you’ll have avoided anchoring bias and kept your plan intact. In a market where narratives change by the hour, that discipline is your edge.
FAQs
Q: Is $87,000 guaranteed if support breaks?
No. $87K is a high-interest liquidity zone, not a guarantee. It becomes more probable when a support break coincides with a leveraged unwind and miner selling. Without that confluence, the Bitcoin price can stabilize above the level or reverse sooner.
Q: What should I watch to know if the trigger is live?
Focus on daily closes around $90K–$92K, open interest and funding resets, and miner outflows to exchanges. If all three deteriorate together, the $87K path is warming up.
Q: Could miners really push price that far?
Miners don’t control markets, but during capitulation they add incremental spot supply at awkward times. If that hits while bids are pulling back, it can accentuate moves toward liquidity magnets like $87K.
Q: If Bitcoin hits $87,000, does that mean the bull market is over?
Not necessarily. Capitulation often marks local or even cycle bottoms, depending on context. The reaction after tagging $87K—reclaiming key levels and rebuilding structure—tells you more than the tag itself.
Q: Is this financial advice?
No. This is educational analysis of a widely discussed scenario for the Bitcoin price based on technicals, market structure, and on-chain context. Always do your own research and consider your risk tolerance before making decisions.
Read More: Crypto Market Crash News Today Latest Updates, Analysis